We are excited to introduce “Power Flow”, a brand-new feature in our MacBook charge limiter app AlDente Pro. Power Flow goes beyond the basics, providing a visual representation of your MacBook’s power usage in real time. Let’s dive into this innovative new feature and see how it enhances your understanding of your MacBook.
What is Power Flow?
Power Flow is a dynamic feature that uses a Sankey diagram to illustrate the power flow in your MacBook. It graphically displays how much power flows from your charger to the battery and MacBook or from the battery to your MacBook. With Power Flow, you can visually understand your MacBook’s energy consumption, which helps you make informed decisions about charging and the usage of AlDente Pro’s features.
How to Use Power Flow
Using Power Flow is easy. Once you launch our app, you just need to click on the “gear” icon in the upper right corner and choose the “Stats” category. Afterward, you will see the Sankey diagram on the main dashboard. It’ll show you the power flow in real time, updating continuously as your MacBook’s energy consumption changes. If you want to see the Power Flow Diagram in the Menubar popover, just enable the “Show in Popover” slider underneath the Power Flow Diagram.
The Diagram Explained
The animation illustrates a continuous flow of energy from the left to the right. On the right-hand side, you can observe the energy consumption of your MacBook, along with the power amount used to charge the battery, if applicable. The source of this energy is demonstrated on the left side. When your MacBook is plugged in and powered by the charger, you’ll notice a lightning bolt symbol on the left, followed by the charger’s power output. Alternatively, when your battery is discharging, the battery icon will appear on the left, alongside a visual depiction of the discharge rate.
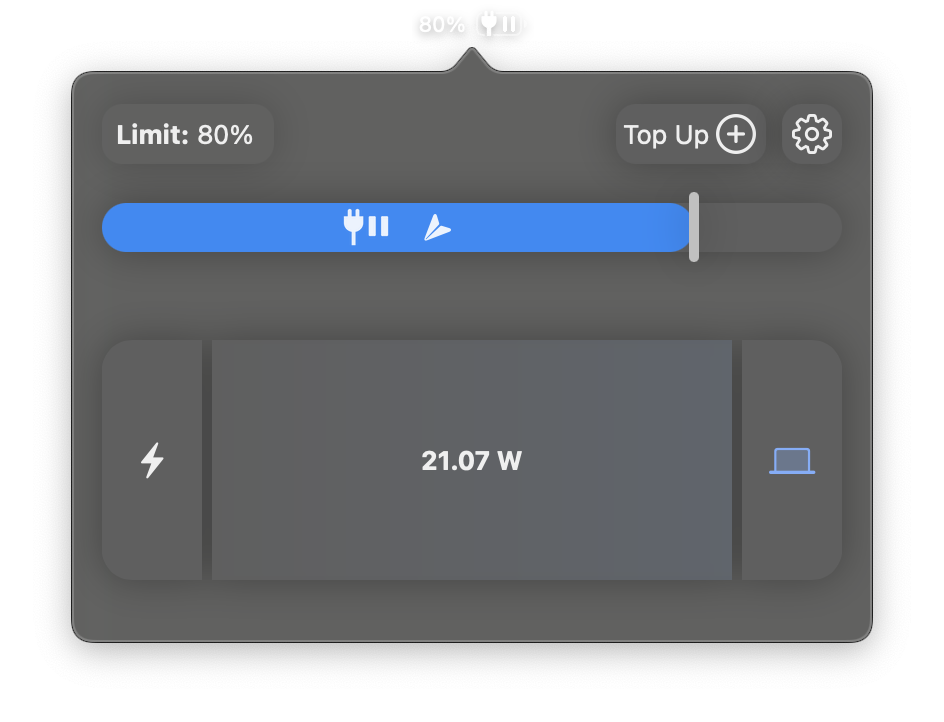
Example 1: Charge Limiter
For a majority of users, this will likely be the most frequent situation. When your MacBook is connected and the designated Charge Limit is attained, the Power Flow diagram illustrates the amount of energy being transferred from the charger to the MacBook.
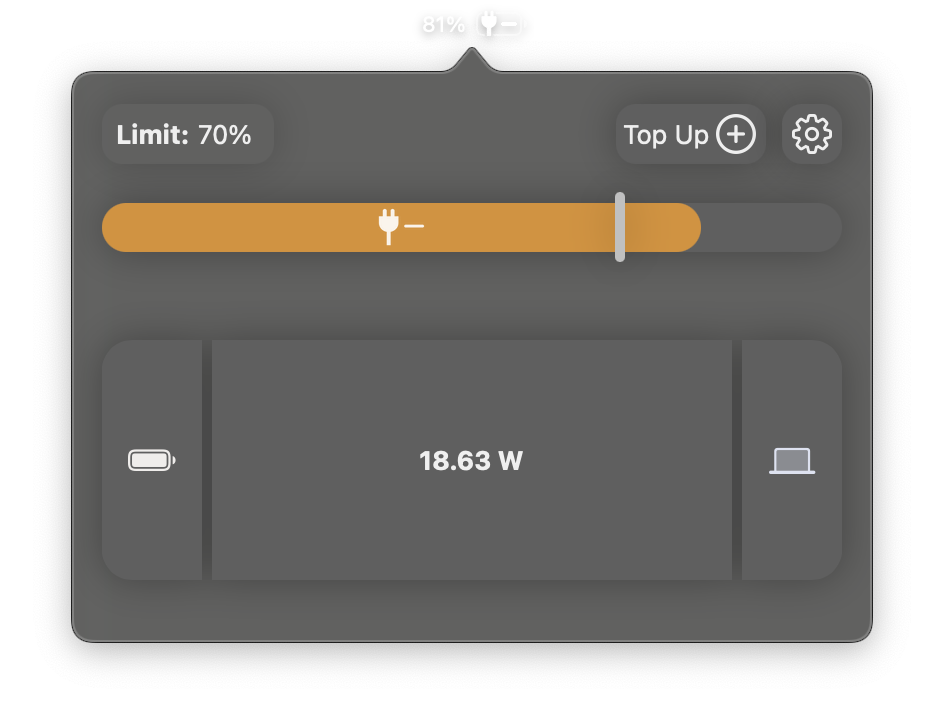
Example 2: Discharge
When utilizing AlDente’s Discharge feature or operating your MacBook unplugged, the Power Flow diagram will visually indicate that your MacBook’s energy source is the battery itself and show the current discharge rate as well.
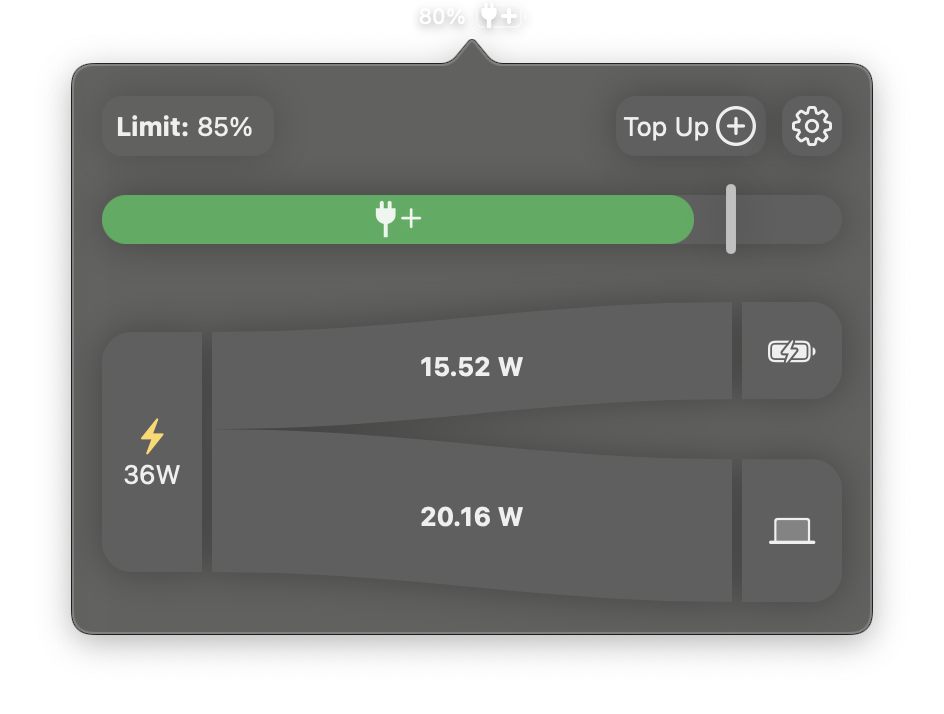
Example 3: Charging
When your MacBook is plugged in and the battery is actively charging, our innovative Power Flow feature provides real-time visualization of the total power being drawn from the power supply. Moreover, it breaks down this energy flow, distinctly showcasing how much is allocated to the MacBook’s operation and how much is utilized to charge the battery, giving you a complete picture of your MacBook’s energy usage.
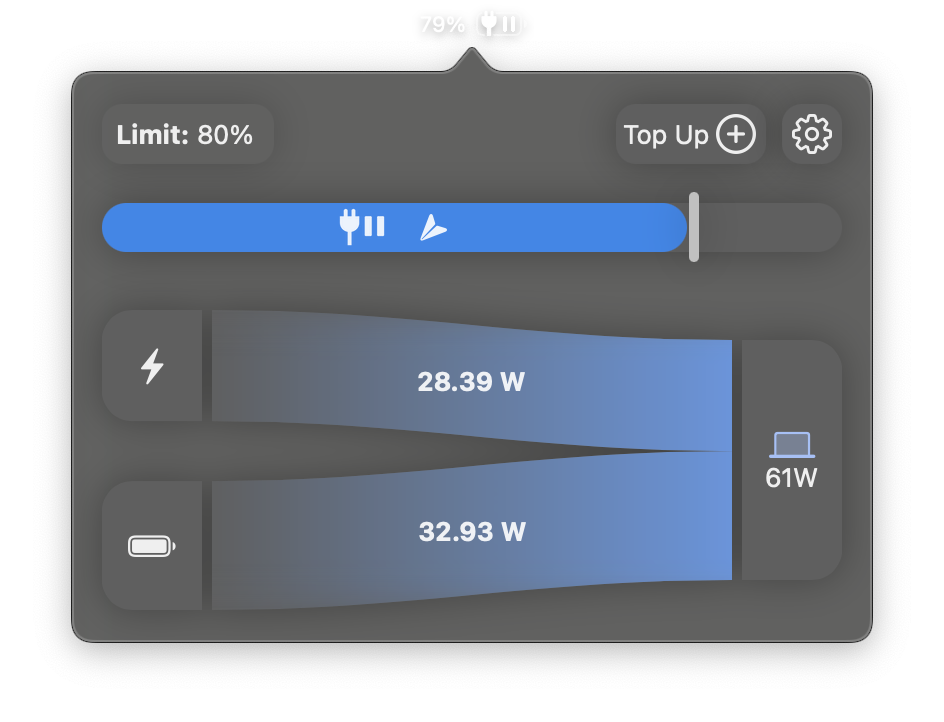
Example 4: Underpowered Charger
Explore unique scenarios with Power Flow, like using a non-standard power supply for your MacBook. This could occur if you’re charging your MacBook through a monitor with a weaker power supply or opting for a smaller, lighter charger for portability. Some users might also intentionally select a lower-output charger to reduce the charging speed, aiming to prolong battery life. However, if your MacBook is running intensive tasks and the charger’s power output falls short, your battery seamlessly steps in to provide the required energy. Power Flow efficiently visualizes these scenarios – displaying the individual power output from the charger and battery on the left, while showcasing the MacBook’s total energy consumption on the right.